
Modeled value
$627,600
$585,600–$669,600
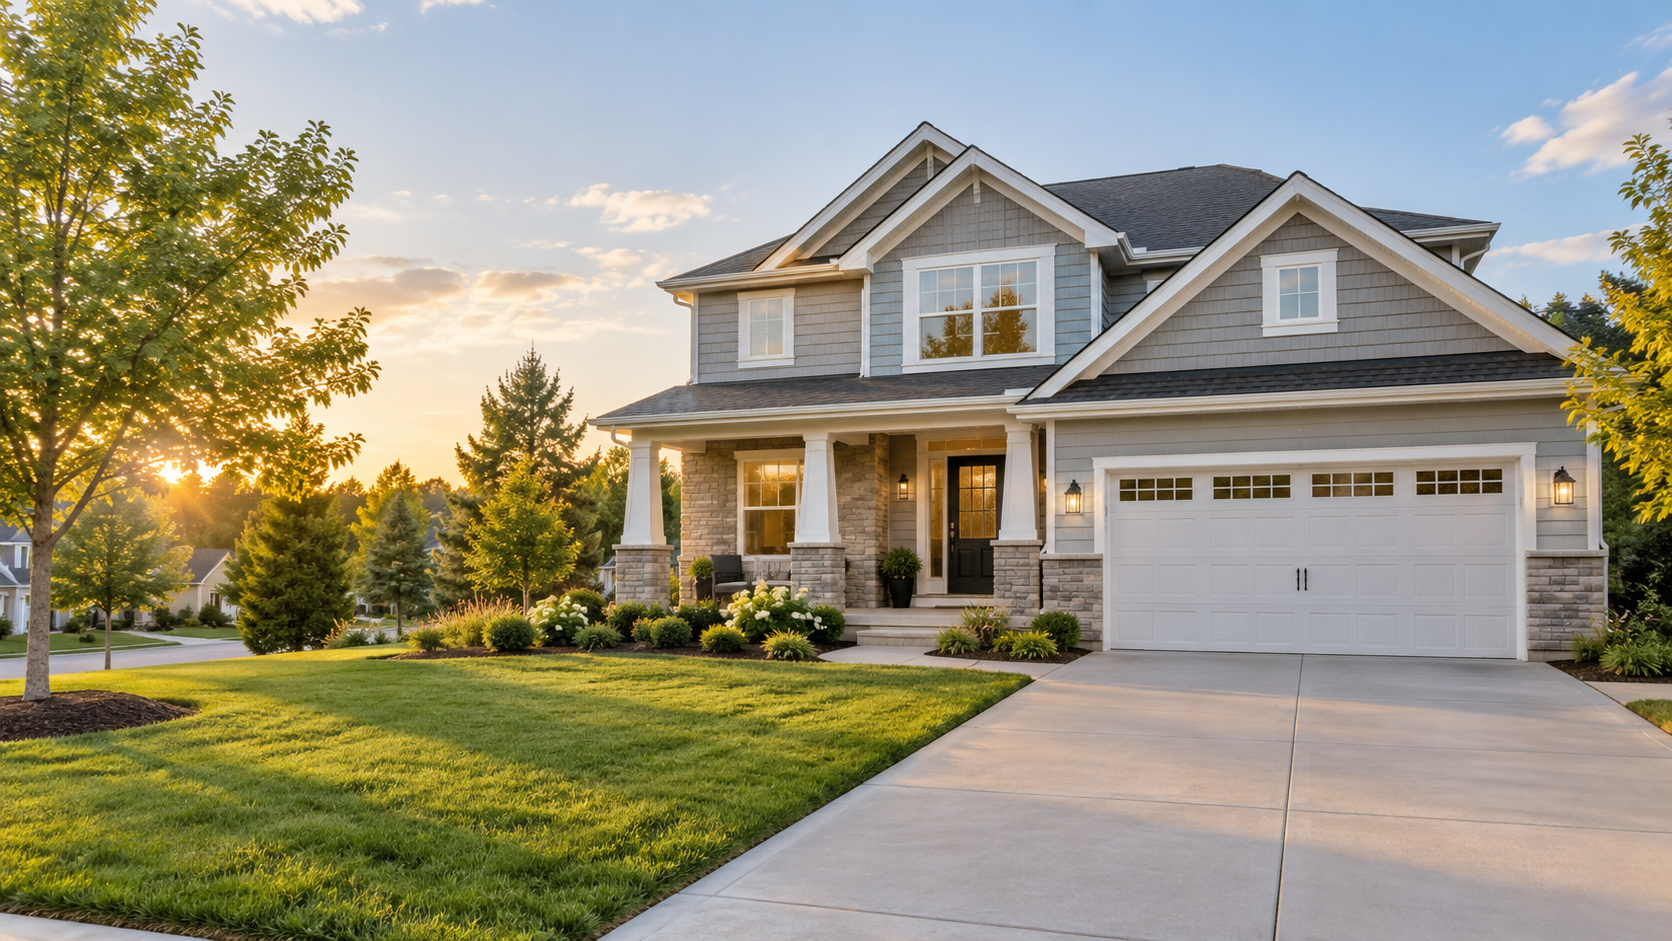
Complete Property Intelligence Report
Austin, TX 78704 · Travis County
Single family · 4 bd · 3 ba · 2,340 sqft · Built 2004
Modeled value
$627,600
$585,600–$669,600
Rent analysis
$3,300/mo
$3,070–$3,530
Gross yield
6.3%
2.8% modeled cap rate
PDI score
69/100
Grade B
Five weighted components from the synthetic sample record
PDI score
Grade B
Composite of five weighted components. Deterministic — the same inputs always return the same score.
TTM submarket move 3.9%, comp dispersion 1.9%
Modeled net yield 2.80% (6.0% = 100)
DOM percentile 34, 3.1 months supply
3.1 months supply, 128 permits (12m)
Zone X (minimal), insurance 6.7% of gross rent
Score model pin-1.1.0. Scores rank modeled relative attractiveness within PDI's dataset only. They are not credit scores, not an appraisal, and not a recommendation. Components can move independently of price.
Synthetic estimates stored for this demonstration
Synthetic PDI sample dataset · modeled as of June 2026. The shaded band represents the modeled low-to-high range.
4 synthetic nearby sale records
| Property | Sold | Price | $/sqft | Sqft | Bd/Ba | Built | Distance |
|---|---|---|---|---|---|---|---|
| 1512 Elm Street | 2026-05-12 | $641,000 | $266 | 2,410 | 4/3 | 2006 | 0.1 mi |
| 908 Bluebonnet Lane | 2026-04-02 | $612,500 | $278 | 2,205 | 4/2.5 | 2001 | 0.4 mi |
| 2210 Cedar Ridge Drive | 2026-03-21 | $668,000 | $265 | 2,520 | 4/3 | 2009 | 0.8 mi |
| 545 Oltorf Court | 2026-02-08 | $598,000 | $262 | 2,280 | 3/2.5 | 1998 | 1.1 mi |
Synthetic PDI sample dataset · modeled as of June 2026. Addresses and transactions are illustrative.
Synthetic parcel and structure detail
Synthetic PDI sample dataset · modeled as of June 2026. No real owner or parcel identity is shown.
Illustrative recorded transaction
Synthetic transaction for layout demonstration only.
Public-record coverage
Data unavailable in sample mode
The complete report checks ownership, deed, assessment and tax sources. No owner or tax facts are fabricated for this sample.
Deterministic reading of sample inputs
Modeled annual carrying assumptions
Synthetic local indicators
Synthetic PDI sample dataset · modeled as of June 2026.
Flags carried by the synthetic record
Three scenario horizons with widening uncertainty
Modeled scenario — Forward values apply the submarket's modeled annual growth, decayed toward a 2.6% long-run trend, with the uncertainty band widening by horizon. Not a guarantee, forecast of sale price, or a recommendation to buy or sell.
Federal and licensed context for South Lamar
Population, income, housing tenure and education
Data unavailable in sample mode
Housing units, vacancy, home values and fair market rent
Data unavailable in sample mode
Employment, establishments, payroll and industry mix
Data unavailable in sample mode
A live report fills these sections only when authoritative area data is available. This sample does not invent federal statistics.
Your next decision starts here
One report brings valuation, rent, comparables, available public records, market context, scoring and modeled scenarios into one decision-ready view.
Important disclosures
Property Data Intelligence produces modeled estimates, not appraisals, broker price opinions, or investment advice. Valuations, rent estimates, scores and forecasts are generated by deterministic statistical models from the data described on each report. Forecasts are scenarios that assume published trend decay; they are not guarantees of future value or return.
Figures come from licensed U.S. property-data sources and are shown with their retrieval date. PDI is not a lender, broker, appraiser, or consumer reporting agency, and outputs may not be used for eligibility decisions covered by the Fair Credit Reporting Act or for Fair Housing–regulated screening.
Verify all figures independently before transacting. Read the methodology and data-source detail.